"Prognosis" View

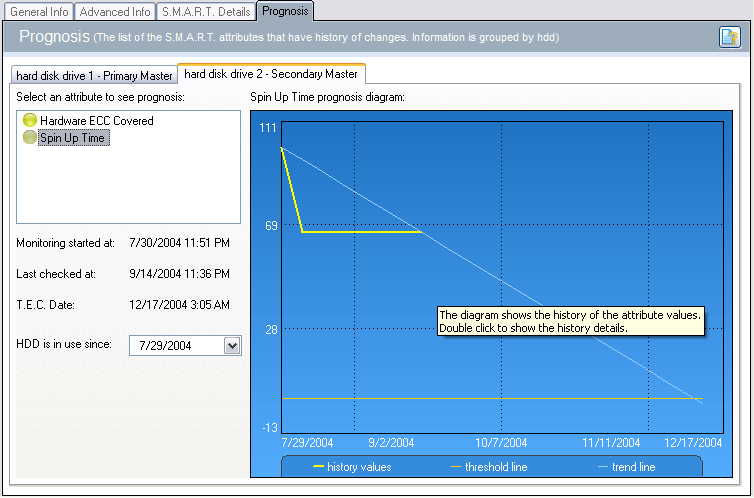
The "Prognosis" view displays the list of the S.M.A.R.T. attributes, which have the history of changes. Information is grouped by HDD (one tab per HDD). The following information is always available:
the S.M.A.R.T. monitoring start date. As a rule, it is the date of the first launching of Hard Drive Inspector.
the date of the last check of the S.M.A.R.T. attributes
the date when you began to use your hdd. It is the S.M.A.R.T. monitoring start date by default. It is highly recommended to put the actual date when you begin to use the HDD. You may also use the HDD issue date, which is sometimes located on the top cover of the HDD. When this date is set, it becomes most likely that Hard Drive Inspector will be able to make a correct prognosis right at the moment, even if you just started to use Hard Drive Inspector. It also significantly improves the prognosisÆs quality. This date cannot be later than the S.M.A.R.T. monitoring start date and earlier than 01/01/1990.
When selecting an attribute, you will see:
T.E.C. (Threshold Exceeded Condition) date. It is the date (forecasted by Hard Drive Inspector) when the value of the indicated attribute exceeds its threshold value. Therefore, it would be unsafe to use the HDD after this date. See the more detailed description of T.E.C. and S.M.A.R.T. in the T.E.C. & S.M.A.R.T. topic. To predict the T.E.C. date more precisely, the program does not calculate it for 3 days after the day S.M.A.R.T. monitoring starts. If none of the attributes have changed value, the T.E.C. date cannot be evaluated. The longer Hard Drive Inspector monitors the HDD, the more precise the forecast of this date will be. Therefore, do not wonder at a big variation of the date immediately after the start of monitoring.
the graphical presentation of the history of an attribute's value changes in the form of a chart control. When double-clicking on it, you will see the dialog with the history list. Yellow line represents the history of attribute's value changes. Red line is the threshold value level. Blue line is an approximated predicted value changes in the form of the linear trend. The projection of the point, where the trend and threshold line intersects the X-axis, is the estimated T.E.C. date.
Note: Don't forget to set the date when you begin to use your HDD.
![]()